Do you want to profit from the markets?
Then ignore the blather on CNBC and other financial news channels. All they focus on are fundamentals like supply, demand and earnings.
The truth is none of that matters much.
What does matter is what the big boys are doing – the Goldman Sachs of the world.
Consider the steep correction in world stock markets in Q4 of 2018.
As global markets were tanking, the talking heads on financial networks implored investors to be patient and hold their positions… they quoted studies that claim buy and hold wins out over time… and argued that stocks typically turn around after a correction.
But what they didn’t talk about was where institutional investors – hedge funds, pension funds, investment banks and the like – were moving their money as the market plunged late last year.
They never talk about that.
That’s too bad because on any given day, institutions can account for more than 50% of all trading volume – and on high-volume days, up to 90%.
So it doesn’t take a genius to see that these “elephants” are the real drivers of the markets.
And like real elephants, they leave tracks that are easy to follow…if you know what to look for.

During the swan dive that began in Q4 of 2018, when the financial “gurus” were urging patience, the elephants were quietly moving money from “growth” to “defensive” investments.
They saw that the correction was going to be severe, especially in growth stocks like tech, consumer discretionary spending and communications services (which always fall harder during market downturns).
For example, from early 2016 to Q4 of 2018, the elephants had ridden tech for all it was worth (during that time frame, the technology sector had more than doubled, up 109%).
There’s nothing unusual about such explosive growth in tech during bull markets.
You see, growth stocks – like semiconductor, software, telecommunications and computer services – always fly higher than defensive stocks in up markets.
But they always fall much harder during corrections.
That’s exactly what happened in Q4 2018, when the US Technology Sector Index (XLK) dive-bombed a whopping 24.5%. And Apple, a darling of the technology sector and institutional investors, crashed a huge 38.9%. (BTW, Berkshire Hathaway owns over 249 million shares of Apple. How is that for a nosebleed?).
While that nosedive was wrecking portfolios coast to coast, the Utility Index (XLU) broke even.
Breaking even while the rest of the market’s tanking is more than acceptable, wouldn’t you say?
Then in January 2019, when everybody else was gun-shy on growth stocks, the elephants began rotating money back into non-defensive and growth stocks.
Result – they caught a nice ride upward.
For example, the US Technology Sector Index (XLK) shot up 39.1% by May 1, 2019.
You could have seen it coming.
If you’d have followed them in Q4 of 2018, you would have saved yourself from steep losses…and if you’d have followed them in Q1 of 2019, you could have benefited from the big tech move of Q1 2019.
So right now I anticipate you have a couple of questions – who am I and why should you listen to me?
I’m John Deck.
I spent over twenty-five years in hi-tech.
As an engineering major in the 1970’s I did numerical and data analysis on scientific data.
A friend working on a graduate degree in finance asked what my analysis would do with stock data.
So I ran some stock data experiments using numerical analysis.
The results were enlightening, and they became the basis for market research I’v done ever since.
Now, my analyses on the stock market has never been published, only shared privately.
But it has been extremely successful.
For example, I used the analysis to run a successful option arbitrage program for three years in the early 1990s for a high net worth client.
In the early 2000s my analysis warned the markets were topping, so I liquidated my hi-tech stocks from company options and ESOP.
That proved to be a smart move, as one company stock lost over 90% of its value within a year.
In 2007, my analysis flashed warning signs again, so I advised some private parties that the bull market looked to be topping.
Result – those who took my advice avoided much of the carnage that ensued into 2009.
But later in 2009, my analysis signaled there was a good chance the market had bottomed – which as we all know was exactly what happened.
Then in 2016 – when many stock “experts” were saying the market was topping – my analysis indicated we were in for a long drawn out correction.
It also showed institutional investors were buying into the market again.
Once again I was right on the money.
What about 2018? More of the same, as you’ll see in a moment
I publish an investors’ communiqué called Global Markets Trends and Review. It comes out once a week and features a thorough analysis of major world markets you can use to track where institutional investors – the elephants – are putting their money.
Instead of relying on fundamental analysis, I employ a wide variety of technical indicators to track their moves.
These indicators include the “Relative Rotation Graph” (RRG), which determines the strength of market trends through those moves.
Check out the following RRG:

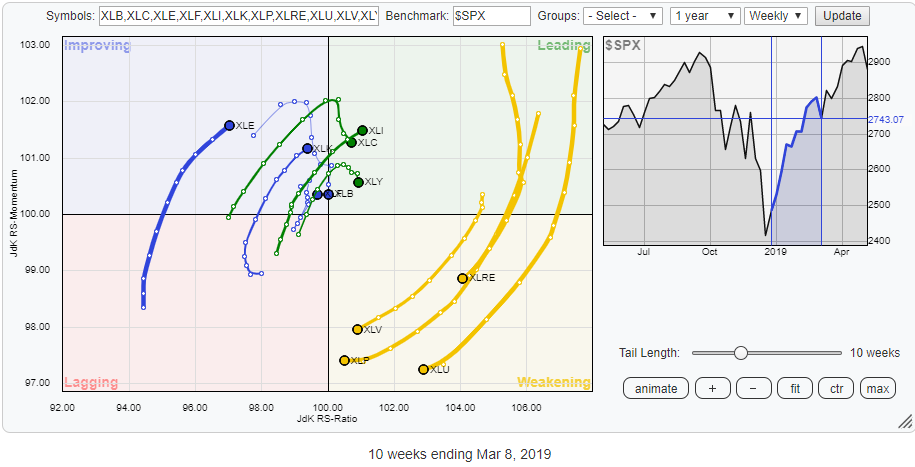
Courtesy of StockCharts.com The terms "Relative Rotation Graph" and "RRG" are registered trademarks of RRG Research.
In the upper right-hand corner are sectors leading the general market. The lower left-hand corner features lagging sectors.
As the market dropped 20%, you can see how defensive sectors led the market (the green tails represent the defensive sectors and show how they moved from lagging to leading indicators as the markets began their late 2018 swan dive).
That’s where the elephants were moving much of their money.
Kind of obvious, right?
The 2018 Q4 correction bottomed on Dec. 24.
A mere 9 days later, the elephants started moving money from defensive sectors back to more aggressive sectors, like tech.
In the chart below, the yellow tails show how defensive sectors moved from leading the market to lagging behind it (the aggressive sectors are shown with blue and green tails, which clearly show how they resumed leading the markets).

Courtesy of StockCharts.com The terms "Relative Rotation Graph" and "RRG" are registered trademarks of RRG Research.
Obvious again, right?
So why didn’t the so-called “experts” report it?
Truth is, it’s not in their interest to do so (that’s a story for another time).
But it’s in your interest to see situations like this and use them to invest more profitably.
And that’s the purpose of Global Market Trends and Review. It provides you with a perspective on the primary market trends and how you can use that perspective to profit along with the elephants of the financial world.
Every issue has a summary of the primary trend of the major global markets.
Take the Oct. 5, 2018 issue for example…
A brief explanation is in order here.
The primary trend is determined by a momentum/trend indicator. This indicator also provides a measure of a trend’s relative strength.
The higher the value, the stronger the trend.
When this value is above zero, the trend is positive. Below zero, it’s negative.
The Oct. 5 table was saying that the primary trend for the major US markets was up, while the primary trend for the world markets was down.
The world markets trend was down served as a warning (it’s highlighted in red on the primary trend, and in bright yellow on the short-term trend).
Why?
Because all the U.S. markets, excluding the S&P 500 and the Russell 1000 index, had turned negative on the short-term trend…and they were on the cusp of turning negative there as well.
Another warning was the change in the S&P 500 sectors, as evidenced by the fact that defensive sectors were leading the market (these are the kind of “elephant tracks” I’ve been talking about – evidence that shows where institutional money is moving).
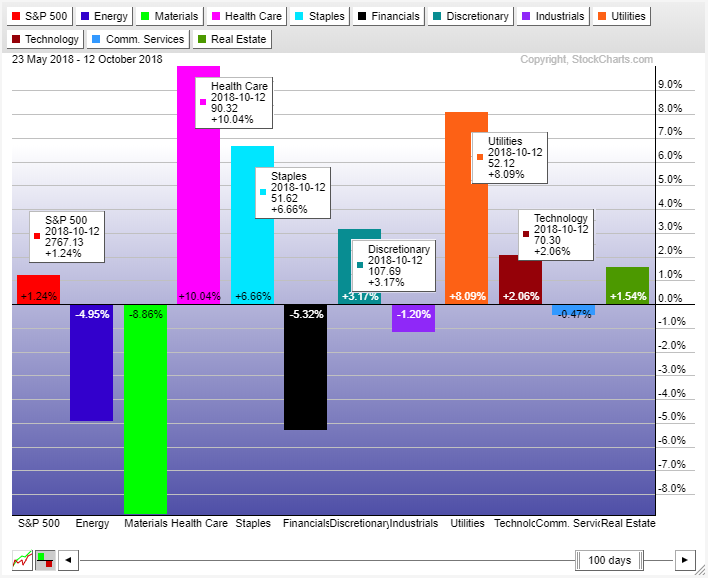
On September 14 relative strength chart, see how the Technology and Consumer Discretionary growth sectors were leading the market. Health Care sector was next which has both growth and defensive stocks.
Less than three weeks later - and a mere three days after our Oct. 5 report (the close of Oct. 8) - the Dow Jones Industrials plummeted 1,008 points.
That was the beginning of a major correction.
To wit, on September 14 the Technology sector was the market leader (it was up 16%).
But only four weeks later on October 12, Technology was falling fast and now up only 2.06%.
The damage was only going to get worst.
Three weeks later, on Oct. 26, l published the following trend summary in Global Market Trends and Review:
All major markets were trending down. The leading U.S. market sectors were Health Care, Consumer Staples and Utilities, all considered defensive sectors.
The reason for this sector shift, of course, was the elephants – they had rotated much of their money into defensive stocks because they saw growth sectors like tech as loosing propositions.
All this jumps right out at you, doesn’t it? You don’t even have to look at the numbers to see what I mean.
Important note; what I’m talking about has nothing to do with predicting market action. We’re simply following elephants as they rampage through the markets.
I can’t stress this enough – institutional (elephant) money drives the markets. Anyone who says otherwise should be avoided like a leper.
By Dec. 24, the S&P 500 index had lost 19.8% from its October high of 2931 (many indices did even worse).
Now consider the Jan. 13, 2019 edition of Global Markets Trends and Review.
As you can see, the major markets were still trending down, BUT short-term trends had begun reversing. Instead of flashing yellow, as they had back in October, they were now flashing green.
Green means go, and in this case it indicated it was now time to put money back to work in more aggressive sectors like tech, communications and consumer discretionary spending.
That’s what the elephants were doing, and had you followed their lead, Q1 of 2019 would have been very profitable for you.
If you had followed the elephants in Q4 2018 and Q1 2019, your portfolio would likely be far more valuable than it is now, right?
So why am I telling you all this?
Because I want you to subscribe to Global Markets Trends and Review.
For a limited time, I’m offering a handful of investors a free subscription to this service.
And that includes you.
Each weekly issue is jam-packed technical investment data, which you get in 5 easy-to-digest sections…
- An introduction/overview of the current markets
- A summary table showing the trends of major U.S. and world markets
- A relative strength chart of the world markets with commentary (to make it easy to see which markets are leading or lagging)
- A relative strength chart of the major U.S. market sectors with commentary (to clearly show where the elephants are putting their money)
- An overall summary wrap-up
On some weeks, you’ll also get special charts and commentary that provide further insights on a major market sector or index.
As I said, right now there’s no charge for subscribing to Global Markets Trends and Review for early subscribers.
But that may change…so I advise you take advantage of this offer now.
To do so, just fill in the simple opt-in form below.
And don’t worry – I won’t give or sell your information to anyone, for any reason.
By signing up you agree to our terms. You will receive regular and sometimes daily market commentary.


